Evaluation of Accelerometer Inter-Device Variability and Collar Placement in Dogs
Anastasia M. Olsen DVM1*
Richard B. Evans PhD2
Felix M. Duerr DVM, MS, Diplomate ACVS-SA, Diplomate ECVS, Diplomate ACVSMR1
1Department of Clinical Sciences, Veterinary Teaching Hospital, Colorado State University, Fort Collins, CO 80525
2RCVS Knowledge, Belgravia House, 62-64 Horseferry Road, London, SW1P 2AF
*Corresponding Author (amolsen@purdue.edu)
Vol 1, Issue 2 (2016)
Published: 05 May 2016
Reviewed by: Wanda Gordon-Evans (DVM, PhD, DACVS DACVSMR)
DOI: 10.18849/VE.V1I2.40
SECTION INDEX: ABSTRACT | INTRODUCTION | METHODS | RESULTS | DISCUSSION | FOOTNOTES | CONFLICT OF INTEREST | REFERENCES | SUPPLEMENTARY FILES
ABSTRACT
Objective: To compare accelerometer inter-device variability and evaluate the effect of canine collar tightness on activity counts.
Evidentiary value: This is a prospective study of six dogs each wearing Actical accelerometers over 24 hours with variable placement to evaluate accelerometer inter-device variability and collar tightness.
Methods: Six skeletally mature medium to large breed client-owned dogs were enrolled in the study. Twelve identical accelerometer devices were used, with the same two devices used for each dog. All accelerometers were placed on the ventral cervical region. A total of four placement patterns (P1: two accelerometers on the same collar; P2: two separate collars with same tightness with one accelerometer on each collar; P3 & P4: one collar loose/one collar tight and one accelerometer on each collar) were evaluated. Pearson’s correlation, paired t-tests, and percent of variation between total activity counts for each placement period were calculated.
Results: For P1-P4, Pearson’s correlation was 0.92, 0.95, 0.93, and 0.86 (p<0.0001 for all comparisons). For P1-P4, t-ratio was -20.59 (p<0.0001), 9.78 (p<0.0001), -8.95 (p<0.0001), and -2.15 (p<0.0313), respectively. When evaluating inter-device variability, the percent differences between total activity counts of device pairs ranged from 2.5 to 56.8%.
Conclusion: While the correlations between devices for all placements were high, the high inter-device variability shows that further investigation is necessary. From this study, the results suggest that changing devices throughout a study should be avoided. We recommend that attachment of the accelerometers to the collar, including collar tightness, should be kept consistent until further studies are available.
Application: When accelerometer data are used for objective outcomes, accelerometer inter-device variability and collar tightness should be taken into account.
INTRODUCTION
Accelerometers have been studied for the objective measurement of activity in animals (Brown et al., 2010; Dow et al., 2009; Hansen et al., 2007; Moreau et al., 2009; Preston et al., 2012; Yam et al., 2011). Previous validation studies have focused on the evaluation of overall functionality of accelerometers as well as device placement on the animal’s body (Brown et al., 2010; Moreau et al., 2009; Preston et al., 2012). For example, accelerometer placement on the ventral portion of the cervical region in dogs has been suggested to be the most convenient and well tolerated while also providing reliable results (Brown et al., 2010; Dow et al., 2009; Hansen et al., 2007; Yashari et al. 2015). In humans, translation equations (Paul et al., 2007; Straker et al., 2012) have been designed to compare data from different models of accelerometers. In the veterinary literature, multiple authors have identified some lack of correlation between currently accepted outcome measures such as validated owner questionnaires, ground reaction forces, and accelerometry (Jones et al., 2014; Malek et al., 2012; Rialland et al. 2012; Walton et al., 2013; Wernham et al., 2011). While it has been suggested that accelerometers are measuring a different outcome that may not be related to established outcomes (Rialland et al., 2012), weak correlations may also be caused by variability in data collection. Specifically, inter-device variability and collar tightness may affect activity counts.
If significant inter-device variability were present, using different accelerometers (regardless of whether the devices are the same model) throughout a study period may influence the collected data. Similarly, if collar tightness is not controlled during a study, a loosely placed collar may be associated with greater activity counts as the collar may be moving more. To the authors’ knowledge, neither collar tightness nor whether the same accelerometer was used throughout the study period has been described in previous studies using accelerometry. These factors have not been investigated as possible sources of variability. As such, the purpose of this study was: (1) to compare the inter-device variability of a commonly used accelerometer and (2) to evaluate the effect of collar tightness on activity counts. We hypothesized that there would be low inter-device variability and that a loose collar would result in greater activity counts compared to a tight collar.
METHODS
Dogs – The study protocol was approved by the Institutional Animal Care and Use Committee (IACUC) at Colorado State University. Six medium-large breed dogs were enrolled in the study and owner consent was obtained for each dog. To be eligible for inclusion, dogs must have been skeletally mature and used to the placement of cervical collars. In addition, all dogs must have been able to ambulate unassisted in their home environment.
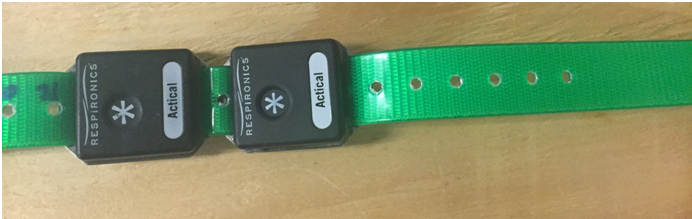
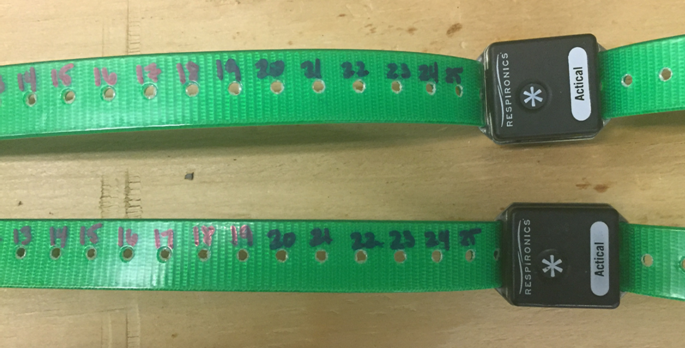
Study protocol – All dogs remained in their home environment throughout the study period and the level of exercise performed was at the discretion of the owner. A daily activity log was recorded by the owner for each dog enrolled. In total, 12 Acticala devices were utilized, and activity in each dog was recorded by the same two Actical accelerometers for each placement pattern. The Actical epoch length was set to 15 seconds, which allowed for a total of 240 data points collected per hour. Data was recorded for a minimum of 24 hours per placement for each dog. All accelerometers were placed ventrally on the same size and brand dog collarb for all placement patterns. The devices were attached by sliding the collar through the metal loop of the accelerometer to ensure a secure fit. A total of four placement patterns (P1-P4) were evaluated over the course of the study. All dogs underwent four different data recording sessions with the activity monitors placed (one session for each placement). All dogs progressed through each placement pattern in the same order, starting with P1. For P1, both accelerometers were placed on one collar (see Figure 4) with a tight fit (defined as a comfortable form fit to the dog’s neck). For P2, two identical collars were placed with the same tightness and one device was placed per collar in identical fashion. For both P3 and P4, the cranial collar was placed loosely (defined as increasing the collar width by four buckle holes [see Figure 5] as compared to the tight fit) and the caudal collar was placed tightly (using the same tightness as for P1 and P2). For P3, one monitor was placed on the cranial collar and one on the caudal collar. For P4, the monitors were switched to the opposite collar (i.e. the monitor on the cranial collar was switched to the caudal collar). The holes in the collars were labeled to ensure placement in the desired tight versus loose placement (see Figure 5).
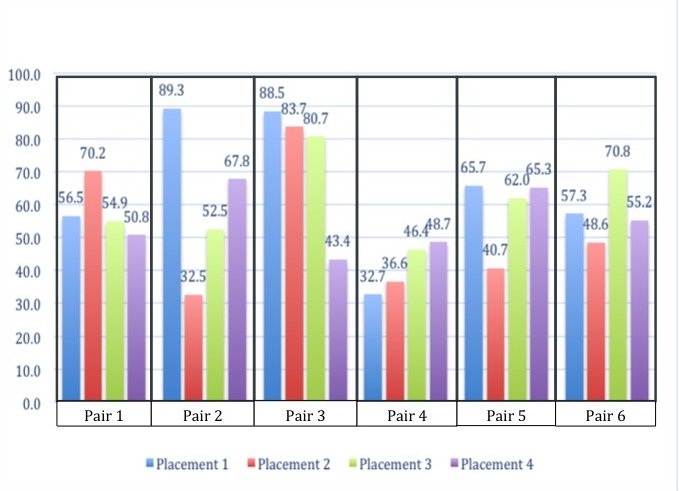
Activity Counts – To further evaluate inter-device variability, the percentage difference between total activity counts for each placement period was calculated for each device pair (1-[Device 1/Device 2]*100). Regardless of device placement on the collar, the same device was labeled as Device 1 and Device 2 for each dog. For P2, Device 1 was defined as the device placed on the cranial collar. For P3, Device 1 was the device that was placed on the cranial (loose) collar. For P4, Device 1 was the device that was placed on the caudal (tight) collar.
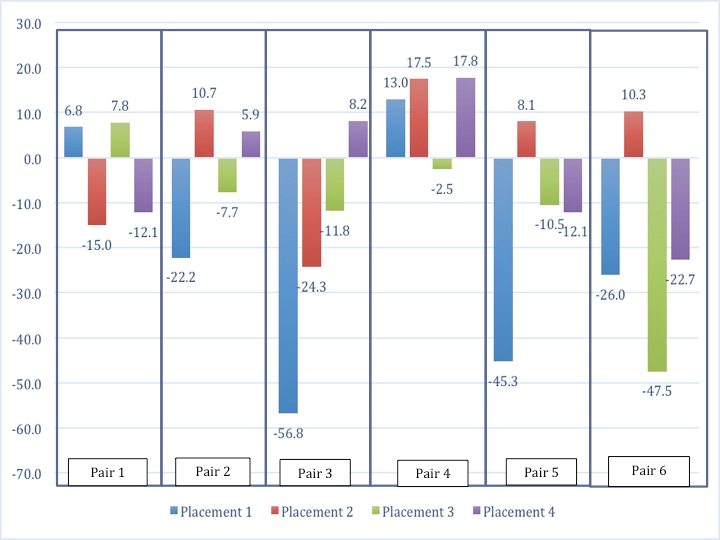
To evaluate inter-device differences for each 15 second epoch, an assessment of which device recorded a greater reading was calculated. Individual activity counts for each epoch were subtracted (Total Activity from Device 1 – Total Activity from Device 2) and the number of positive (i.e. Device 1 recorded a larger activity count than Device 2) and negative (i.e. Device 2 recorded a larger activity count than Device 1) ‘subtracted activity counts’ was then divided by the total number of counts during a placement period. All epochs where both devices recorded zero activity were excluded from this calculation.
Statistical Analysis – Two analyses were used to measure the agreement between the devices for each placement using commercially available softwarec. Pearson’s correlation measured the linear relationship (with visual inspections of the scatterplots confirming the linearity), and paired t-tests assessed any shift of the data between devices by a constant (i.e., translation). Statistical significance was set at p≤0.05.
RESULTS
Pearson’s Correlation and Paired t-tests
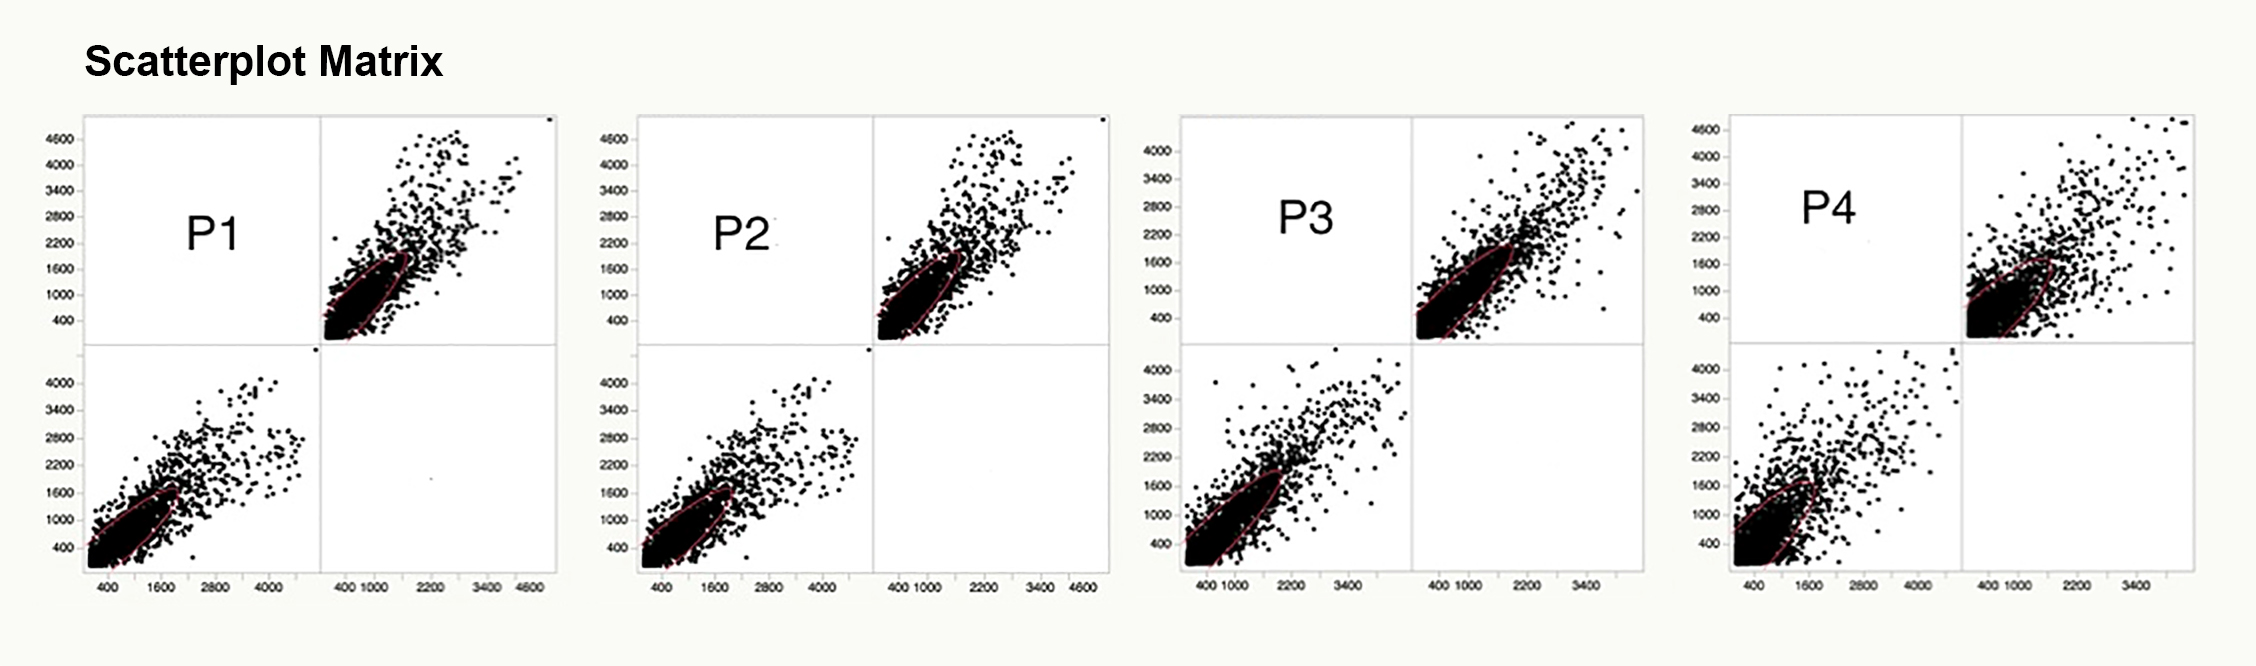
For P1-P4, Pearson’s correlation for activity monitor counts for each monitor was 0.92, 0.95, 0.93, and 0.86, respectively. Pearson’s correlation results were statistically significant (p<0.0001). Scatterplot matrix activity count data are represented in Figure 1. For P1-P4, t-ratio was -20.59 (p<0.0001), 9.78 (p<0.0001), -8.95 (p<0.0001), and -2.15 (p<0.0313), respectively.
Activity Counts
When evaluating inter-device differences, the percentage difference between total activity counts of device pairs ranged from 2.5% to 56.8% (mean 28.3%, 14.3%, 14.6%, and 13.1% for P1-P4, respectively) for all placements with the largest difference during P1 and the smallest during P3 (see Figures 2 and 3 for graphical depiction of these results).
DISCUSSION
We identified good correlations between devices; however there also appears to be a large difference between activity counts measured by the devices. This is not necessarily surprising since a high correlation does not require that devices measure the same exact number of activity counts. However, this inter-device variability does not appear to be consistent. When evaluating patterns of activity counts we did not identify that one device consistently over- or underestimates activity counts. Furthermore, we did not identify a clear pattern when evaluating the different placements and collar tightness. When comparing collar tightness, it was expected that a loose device would show higher recordings. As such, the number of positive values for ‘subtracted activity counts’ should fall above and below baseline for P3 and P4. However, regardless of which placement may serve as the more accurate ‘baseline’ for comparison of collar tightness, this was not observed consistently either. The reason for our findings may be that collar tightness does not affect activity counts or that other factors may have a greater influence on activity counts. Since we did not use the same device pairs on multiple dogs, it is not possible to evaluate whether these findings may be associated with the study subjects (individual dogs) or the actual devices.
There are several activity monitoring devices currently available for use in veterinary patients. One such device is the Actical activity monitor, which is used to measure total activity counts over a period of time. The Actical accelerometer weighs 16 grams, can be attached to a dog collar, and operates using a lithium coin cell battery. The Actical device uses an accelerometer, which integrates the amplitude and frequency of motion and produces an electrical current that varies in magnitude. The device has a tri-axial range (vertical, horizontal, and diagonal) and the plane is selected based on which has the highest amplitude and frequency of motion (Mitter, 2008). An increased intensity of motion produces an increase in voltage. This information is reported in activity counts over a period of time. The Actical devices are calibrated at a factory prior to purchase to ensure accuracy, however it is unknown whether this calibration may lose accuracy over time. Further studies evaluating the age of the device in relation to activity counts over time should be pursued. The Actical devices in this study ranged in age from three months to 1 year, which may contribute to variable data. In addition, a calibration test may be required throughout the life of the accelerometer to ensure accuracy in data collection.
Although previous studies have reported on the validity and use of accelerometers in dogs, consistent device and collar placement have not been reported. For this reason, it is unknown how our results may impact interpretation of previous results. Furthermore, while consistent device and collar placement were employed throughout the study herein, the data was collected on dogs in their normal home environment which includes additional factors such as dog to dog variability in activity, environment, and the types of activities performed in a 24 hour period. As such, it would be ideal to test the accelerometers in a consistent setting such as a ‘robotic dog’ to allow for controlled movements in a repeatable fashion and reliably test inter-device variability, while also replicating similar movements to that of a living dog to ensure applicability of the results.
While we were unable to confirm our hypothesis, the results from this study should not be interpreted to suggest that collar tightness does not affect activity counts. Rather, our results show that accelerometry can be variable and is likely affected by many factors that are currently not accounted for. While the correlation between devices for all placements was high, the inter-device variability shows that further investigation into the reasons for these findings is necessary. It has previously been shown that dogs with osteoarthritis treated with carprofen showed a 20% increase in activity counts (Brown et al., 2010). Given our findings that inter-device variability may be as high as 57%, controlling for any variables that may affect activity data is indicated. The results from our study suggest that changing devices throughout a study should be avoided. Furthermore, until further studies are available, we suggest that attachment of the accelerometers to the collar (including collar tightness) should be kept consistent.
- Actical, Respironics Mini Mitter Division, Bend, OR.
- 3/4” Collar Strap, SportDOG, Knoxville, TN.
- JMP Software, Version 11.2.0, SAS Institute, Cary NC.
Conflict of Interest
Acknowledgments: None.
Funding: Partial funding for this study was provided by the Eldred Foundation.
Competing interests: There are no conflicts of interest to report.
References
- Brown, D.C. Boston R.C., Farrar J.T. (2010) Use of an activity monitor to detect response to treatment in dogs with osteoarthritis. Journal of the American Veterinary Medical Association, 237 (1) pp. 66-70 http://dx.doi.org/10.2460/javma.237.1.66
- Dow, C. et al. (2009) Evaluation of optimal sampling interval for activity monitoring in companion dogs. American Journal of Veterinary Research, 70 (4) pp. 444-448 http://dx.doi.org/10.2460/ajvr.70.4.444
- Hansen, B.D. et al. (2007) Evaluation of an accelerometer for at-home monitoring of spontaneous activity in dogs. American Journal of Veterinary Research, 68 (5) pp. 468-475 http://dx.doi.org/10.2460/ajvr.68.5.468
- Jones, S. et al. (2014) Use of accelerometers to measure stress levels in shelter dogs. Journal of Applied Animal Welfare Science, 17 (1) pp. 18-28 http://dx.doi.org/10.1080/10888705.2014.856241
- Malek, S. et al. (2012) Effect of analgesic therapy on clinical outcome measures in a randomized controlled trial using client-owned dogs with hip osteoarthritis. BMC Veterinary Research, 8 (1) pp. 185 http://dx.doi.org/10.1186/1746-6148-8-185
- Mini Mitter, (2008) Actical Instruction Manual Version 2.12. pp. 1-6.
- Moreau, M. et al. (2009) Use of a tri-axial accelerometer for automated recording and classification of goats’ grazing behaviour. Applied Animal Behaviour Science, 119 (3-4) pp. 158-170 http://dx.doi.org/10.1016/j.applanim.2009.04.008
- Paul, D.R. et al. (2007) Comparison of two different physical activity monitors. BMC Medical Research Methodology, 7 (1) pp. 26 http://dx.doi.org/10.1186/1471-2288-7-26
- Preston, T. Baltzer, W. and Trost, S. (2012) Accelerometer validity and placement for detection of changes in physical activity in dogs under controlled conditions on a treadmill. Research in Veterinary Science, 93 (1) pp. 412-416 http://dx.doi.org/10.1016/j.rvsc.2011.08.005
- Rialland, P. et al. (2012) Clinical validity of outcome pain measures in naturally occurring canine osteoarthritis. BMC Veterinary Research, 8 (1) pp. 162 http://dx.doi.org/10.1186/1746-6148-8-162
- Straker, L. and Campbell, A. (2012) Translation equations to compare ActiGraph GT3X and Actical accelerometers activity counts. BMC Medical Research Methodology, 12 (1) pp. 54 http://dx.doi.org/10.1186/1471-2288-12-54
- Walton, M.B. et al. (2013) Evaluation of construct and criterion validity for the 'Liverpool Osteoarthritis in Dogs' (LOAD) clinical metrology instrument and comparison to two other instruments. PLoS One, 8 (3) pp. e58125 http://dx.doi.org/10.1371/journal.pone.0058125
- Wernham, B. et al. (2011) Dose reduction of meloxicam in dogs with osteoarthritis‐associated pain and Impaired mobility. Journal of Veterinary Internal Medicine, 25 (6) pp. 1298-1305 http://dx.doi.org/10.1111/j.1939-1676.2011.00825.x
- Yam, P.S. et al. (2011) Validity, practical utility and reliability of Actigraph accelerometry for the measurement of habitual physical activity in dogs. Journal of Small Animal Practice, 52 (2) pp. 86-91 http://dx.doi.org/10.1111/j.1748-5827.2010.01025.x
- Yashari, J.M. Duncan, C.G. and Duerr, F.M. (2015) Evaluation of a novel canine activity monitor for at-home physical activity analysis. BMC Veterinary Research, 11 (1) pp. 46 http://dx.doi.org/10.1186/s12917-015-0457-y
Supplementary files, Images & Tables
All the supplementary files are available here.
Intellectual Property Rights
Authors of articles submitted to RCVS Knowledge for publication will retain copyright in their work, but will be required to grant to RCVS Knowledge an exclusive licence of the rights of copyright in the materials including but not limited to the right to publish, re-publish, transmit, sell, distribute and otherwise use the materials in all languages and all media throughout the world, and to licence or permit others to do so.
Authors will be required to complete a licence for publication form,and will in return retain certain rights as detailed on the form.